What are Visual Dashboards
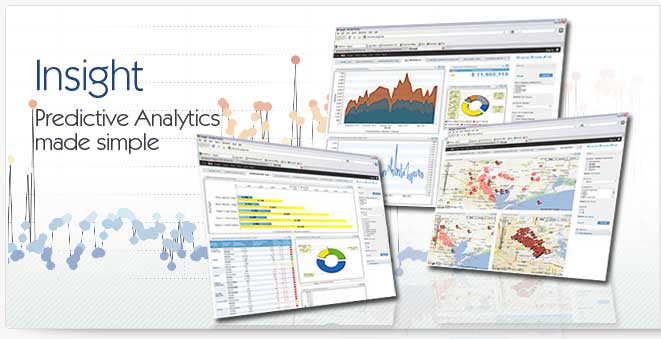
Visual dashboards are simply collections of charts, graphs and other reports created in a business intelligence system for the purpose of providing business users with key information on company performance. A visual dashboard is often a collection of reporting and charting objects designed to work in concert with one another to provide greater depth of understanding than any single chart could do on its own. Through visual dashboards users can gain better understanding of the company's metrics and the performance of the organization against both global and individual goals.
Planning Visual Dashboards
The first step in visual dashboards is the process of planning what data and what charts should be on the visual dashboards. This process will invariably lead back to the users and the company's management team that will need to lay out the key performance indicators and metrics that will be important in understanding if the company is performing up to expectations, falling behind or staying ahead. With visual dashboards it's critical to prepare the right data to ensure that managers are making decisions based on valid information, rather than simply making decisions.
Creating Visual Dashboards
Historically the process of creating visual dashboards has fallen into the hands of either IT professionals or business analysts dedicated to creating and maintaining visual dashboards. New visual dashboard software, however, is making it possible to put that responsibility in the hands of the actual users of the visual dashboards. The biggest benefit of this approach is that it allows the person who has the most to gain from the visual dashboards to be a critical part of using, creating and updating visual dashboards, ensuring that the visual dashboards are effectively being used.
Deploying Visual Dashboards
The process of deploying visual dashboards varies by platform, but from a software perspective there are a number of requirements that any administrator will want to consider. First, is the concept of rights. Specifically, which users should be allowed to create visual dashboards? which users should be allowed to publish visual dashboards to other users? What data should be exposed to which visual dashboards? All these considerations will need to be identified and set up in the business intelligence system through a process of creating rights and permissions.
Updating Visual Dashboards
Theoretically the data behind the visual dashboards should be updating dynamically, without any user input. The goal of planning the updating process then is focused more on changing the content of the visual dashboards. With the right software platform this too can be an easy and relatively silent process. If the users have the permission and authority to create the visual dashboards they will be able to update them as the business changes, giving the organization an ideal mix of visual dashboards usage in as near a real-time manner as possible.
|