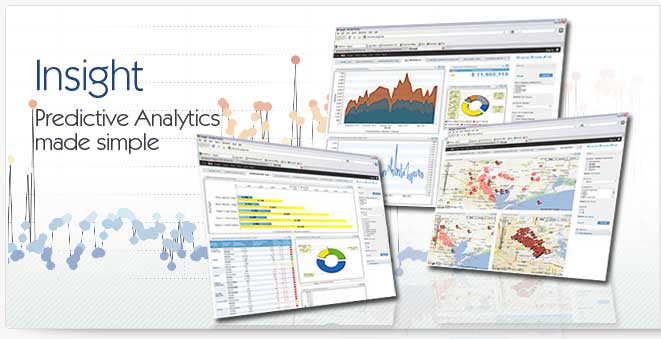
The Dashboard Graph
A dashboard graph is simply a visualization of data in one of any number of formats. A bar graph is an example of a dashboard graph as is the pie chart, the line graph and the area graph. Dashboard graphs are different from traditional charts and graphs from their placement, namely the fact that dashboard graph are typically displayed on a "dashboard", a collection of charts and graphs typically related to one another displayed in a dashboard metaphor. The dashboard graph has become an integral part of helping the modern business executive make critical decisions.
The Dashboard Graph vs. The Spreadsheet Graph
Why dashboard graphs? The answer is simple, while as an individual element the dashboard graph is not much different in usefulness and scope from the spreadsheet graph, the dashboard graph in fact can provide a great deal more information and usefulness in three critical ways. First, the dashboard graph can be directly attached to the data source; as the business data changes the dashboard graph changes instantly. Second, the dashboard graph can provide a great deal more interactivity, allowing the user to explore data at more granular levels. FInally, the dashboard graph can provide context information to the data by being displayed alongside other dashboard graphs that display related data.
Getting Started with the Dashboard Graph
Getting started with a dashboard graph is heavily dependent on the software platform used to create and display the dashboard graph. These software platforms, known as business intelligence software, provide users with the ability see and interact with a dashboard graph in order to benefit from business data in near real-time. Traditionally the dashboard graph has been significantly more difficult to create than a spreadsheet graph. As IT resources have become more constrained, and as the need for fast decision-making has increased, a new concept called "ad-hoc" charting has spurred the creation of a new set of dashboard graph creation tools that make it easier and significantly more advantageous for business users to create a dashboard graph with no IT input.
Getting Data to the Dashboard Graph
The biggest challenge in deploying a BI platform that can enable the dashboard graph is finding and bringing the relevant data to the dashboard graph platform. Traditionally this has been done through what's known as a data warehouse. The data warehouse acted as a central repository of data needed to power any dashboard graph required by the organization. As the need for dashboard graph software has migrated to companies with smaller IT organizations, the ability to send real-time data to the dashboard graph has grown as well. Modern platforms enable this by allowing the dashboard graph software to take data directly from production systems, where the data lives, bypassing the need for a costly data warehouse.
Real-Time and the Dashboard Graph
Another related concept to the dashboard graph is the notion of "real-time data delivery." In the past dashboard graphs were mostly static and updated as the data became available in the data warehouse. This often meant that each dashboard graph was quickly out of date against the source data. In past this has not been a critical problem, but as the pace of business has accelerated, the need to have up to the minute accurate data in any dashboard graph has increased accordingly. This has led to the creation of new tools like EMANIO Context! that enable the real-time delivery of data.
|