Definition of a Dashboard Chart
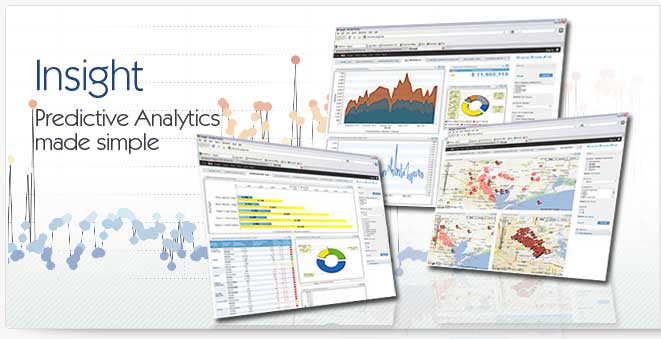
A dashboard chart is simply a data graph like a pie chart or a bar chart that is being displayed inside a dashboard. A dashboard chart is typically an element used inside a dashboard of some sort. A dashboard chart is designed to provide information about a specific data set, usually as part of a larger set of dashboard charts, all working together to provide a business user with a set of key metrics focused on charting business performance against corporate goals or strategy.
Dashboard Chart vs. Spreadsheet Chart
The biggest difference between a dashboard chart and a spreadsheet chart is that the data behind a dashboard chart is typically refreshed on a pre-determined interval. As this happens the dashboard chart updates and changes based on how the data behind it has changed. This is usually accomplished through a business intelligence software platform that has been deployed to publish the dashboard chart. The frequency of updates of the dashboard chart is typically dictated by the settings of the dashboard chart and the capabilities of the underlying system.
Usage of a Dashboard Chart
A dashboard chart has a number of different uses. At its most basic function the dashboard chart is designed to provide updated information to the state of a key metric. A pice chart on sales for example might display sales performance by region. As the sales for the organization grow the pie chart will change. A dashboard chart can also be used in other methods as well. Many systems allow a dashboard chart to be exported from the system so that it can be used in more traditional means. In this same example the dashboard chart might be exported for use in a corporate presentation.
Features of a Dashboard Chart
At first blush the concept of "features" of a dashboard chart might seem redundant. In the case of business intelligence dashboards, however, this is not the case. A dashboard chart in a business intelligence system will often times provide a number of features and functions designed to let the user "manipulate" the chart to gain more insight. The dashboard chart might provide drill-down capabilities for example, or it might provide "drill-through" capabilities where the dashboard chart upon clicking on a segment passes variables to another dashboard chart. For example, clicking on the "northwest region" slice of a pie chart might send the north west region and fiscal year 2007 variables to a bar chart showing sales manager expenses.
Dashboard Chart Examples
There are a number of different types of dashboard chart and the ones available will often vary depending on the system being used. The most common types of dashboards charts include a line chart, a pie chart, a bar chart and an area chart. Beyond these basics, however, there are dashboard charts that can provide significantly more information based on more complex data. A scatter dashboard chart for example can often be used to measure as many as four variables on a single chart.
|