|
Getting the most out of your EDI investment has traditionally meant having a reliable, fast, automated solution that allowed you to simply get EDI transactions into and out of your back-end system with minimal effort. That model, however, has quickly become outdated as new economic pressures force organizations to re-evaluate every aspect of their business. How efficient is your EDI process? Which trading partners are costing you money? Which partners do you receive the highest return on investment with? Answering questions like these, along with other key metrics, is now a critical part of managing an effective EDI environment.
Traditionally, EDI reporting has meant a crudely constructed text report that at best included a pie chart or bar graph designed to lend a "modern" feel to an otherwise outdated reporting model. Truth is, knowing how many transactions you received this month through EDI is just the beginning. Sophisticated organizations require a new dashboard-style approach that not only provides invaluable key metrics - right out of the box - but that also provides heavy customization capabilities and that can provide insight to those responsible for managing EDI, as well as those who rely on the information hidden within the EDI data stream to make critical decisions - your executives.
At the heart of TPI 360 is a sophisticated, enterprise-grade, reporting module that provides the type of EDI and business reporting you need. It comes pre-built with a key set of dashboards that will allow you to visually and instantly gauge inbound transactions in any way you see fit - be it by transaction type, by trading partner, by status - however you want, instantly. With TPI 360 you can finally stay on top of what is happening to your EDI processes on a minute by minute basis without having to navigate lengthy and complex log files or wading through pages of text-based reports.
Any reporting system, however, is only as useful as it is applicable to your individual business. TPI 360's dashboard reporting gives you vast flexibility in creating custom reports, giving you the power to analyze your EDI data in any number of ways your organization requires.
Beyond the need for custom reporting, however, TPI 360 also gives you the ultimate benefit of being able to relate your EDI data to other data your company has at its disposal. That's because the reporting module of TPI 360 can be easily adapted to accept data from other data sources like your in-house ERP system, CRM system or data warehouse, giving you ultimate flexibility in creating key performance indicators and dashboards that can finally close the circle on your use of EDI, giving you a complete picture of your organization's health and well being - all from one centralized dashboard.
Of course, because TPI 360's reporting module is at its heart a full Business Intelligence system, the type of reporting you can perform is completely up to you. Advanced relational lining allows you to pass data from one chart type to another - giving you infinite drill-down capabilities and giving you the power to start at the highest of summary information, like sales by territory, and end at the utmost of detail, letting you progressively drill-down all the way to an individual EDI transaction.
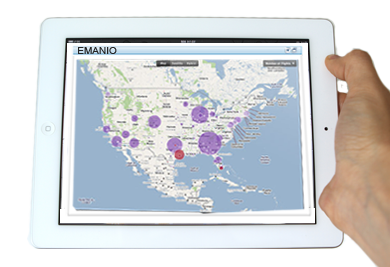
Getting the most out of your data, whether EDI or otherwise, is also about options, and that includes the types of visualizations your reporting system offers. With TPI 360 you benefit from 30 different visualization options - all at your disposal - including GIS reporting, Google maps integration and countless other data visualization forms that will help you get the most out of your data and out of your partner relationships.
|